Home / Deep Analysis / Footfall analysis
Footfall analysis

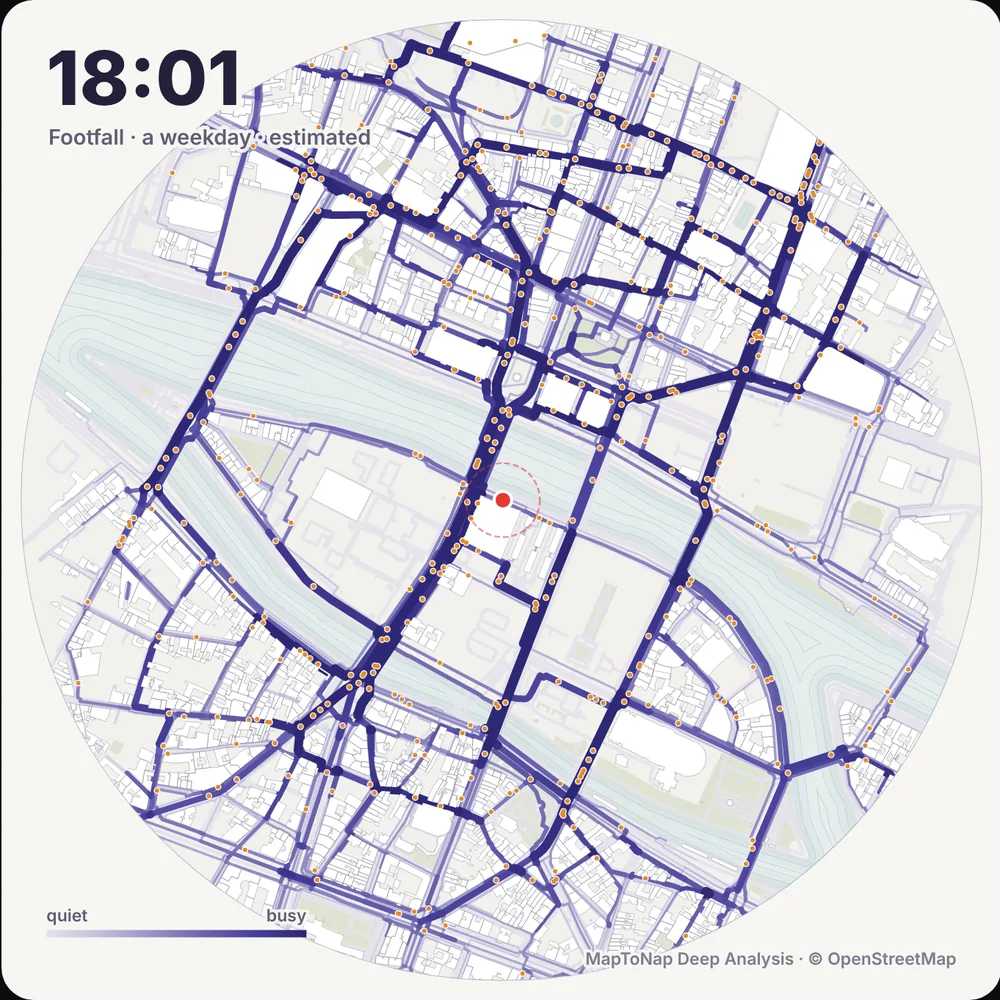
Pedestrian footfall, hour by hour, on the real site

Footfall estimates how many people walk each street around your site at every hour of the day, from homes, stations, workplaces and the places open at that hour. Tap a point to see its busiest hour, read it with sun, shops or missing green, and take the result to a board. It is an estimate from open data, and every result says what it stands on.

Weekday and SaturdayRead with sun, shops or greenData completeness on every resultPart of Max
Hour-by-hour pedestrian footfall read with shops around Porta Venezia, Milan, in MapToNap Deep Analysis
What you can make

The drawings, and what each one shows

Hour by hour

Footfall on every street from early morning to night, as an animation you can scrub or export as a 24-hour video.

Weekday or Saturday

Opening hours and trips change through the week; switch between a weekday and a Saturday.

Busy and sunny

Footfall on streets in direct sun at that hour: welcome in winter, a heat risk in summer.

Busy and shopping

Footfall where there are shops and cafés along the street: where an entrance or a frontage earns most.

Busy, no green

Busy streets with no green nearby: where planting would reach the most people.

A result you can trust

The busiest hour at the red point, its rank among the named streets, and what share of the day passes in the evening, with the data behind it: buildings, places, streets and stops, each marked mapped or estimated.

Examples

Straight out of MapToNap

Untouched exports from real sites. Free drawings carry a watermark; Pro and Max drawings are marked.

Map data © OpenStreetMap contributors, available under the Open Database Licence. The images are MapToNap output.

Guide

How to use a footfall estimate in a design

  1. Pick the hours that matter. A shop entrance cares about the evening peak, a school about the morning. Read the hour that matches the programme.
  2. Compare a weekday and a Saturday. Streets that are quiet on weekdays can be the busiest on a Saturday, and the other way round.
  3. Overlay the question. Read footfall with sun, shops or missing green to turn a heat map into a design argument.
  4. Rank, do not count. Footfall is an estimate from open data, not a pedestrian count. Use it to compare streets and hours, and say so on the board.
  5. Check the data note. Each result lists how much of the buildings, places and opening hours are mapped or estimated. Where most is estimated, treat the result as a first reading.
Frequently asked questions

Before you start

Is this measured pedestrian data?

No. Footfall is an estimate built from open data: homes, stations, workplaces and the places open at each hour, with walkers moving along the street network. It is good for comparing streets and hours, not for counting people.

What do the overlays show?

Three readings on top of footfall: Busy and sunny (footfall on streets in direct sun at that hour), Busy and shopping (footfall along shops and cafés) and Busy, no green (busy streets with no green nearby).

Can I put the result on a board?

Yes. Show the result gives the numbers, an hour-by-hour chart and a conclusion, and you can save it as an A3 PNG sheet. The animation exports as a 24-hour video.

Which plan includes Footfall?

Footfall is one of the Deep Analysis studies, part of Max. You can try it free on the Paris sample.

Is it free?

You can try MapToNap free: four 2D drawings (roads, land use, green and water, urban fabric) and one 3D drawing, with a watermark and no sign-up. Without the watermark and with all 92 analyses there are one-time passes: Pro €7.99 or Max €12.99 for 30 days, or a year of Max for €49. Nothing renews automatically.

Do I need to install anything? Does it work on a phone?

No installation and no setup. MapToNap runs in the browser on any computer, tablet or phone, iPhone or Android: open maptonap.com/app, type an address and press Generate. 3D drawings and simulations run smoothest on a computer.

Related

Keep going