Is there a free online site analysis tool for architecture?
Yes. MapToNap runs in the browser and draws four site analysis diagrams (roads, land use, green and water, urban fabric) and one 3D drawing for any address for free, with a watermark and no sign-up. The other analyses need a one-time 30-day pass: Pro €7.99 or Max €12.99, or a year of Max for €49.
Which website can I use for a site analysis?
For the base drawings, an online site analysis tool such as MapToNap draws the analyses from OpenStreetMap, NASA POWER climate and open elevation data. For official information, use your city's planning portal and maps for zoning rules, and a survey for exact levels; the online tool does not replace either.
Do I need GIS or CAD skills to use it?
No. You type an address or click the map, choose the analyses and generate them. If you want to keep working, the drawings open in Illustrator, Affinity or Inkscape as SVG or PDF, and the 3D model opens in Rhino, Blender or SketchUp.
What is an architecture site analysis diagram?
It is a visual study of the physical and urban conditions around a design site, such as movement, land use, green space, sun, wind and context.
Can I choose only some analyses?
Yes. The analysis types are selectable, so you can generate only the diagrams relevant to the project.
Can I upload a map or image?
For context mapping workflows, MapToNap can also use an uploaded image as a source.
Is MapToNap free?
You can start for free. Four analyses can be generated for free without signing up, with a watermark on exports. Pro and Max need a one-time 30-day pass, and there is no subscription.
Will my pass renew automatically?
No. A 30-day pass expires on its own. We email a reminder 3 days before it ends, and you decide whether to buy again.
Are the diagrams AI-generated images?
No. They are generated from map data, analysis rules and editable graphic geometry.
Can the visual analysis use real street photos?
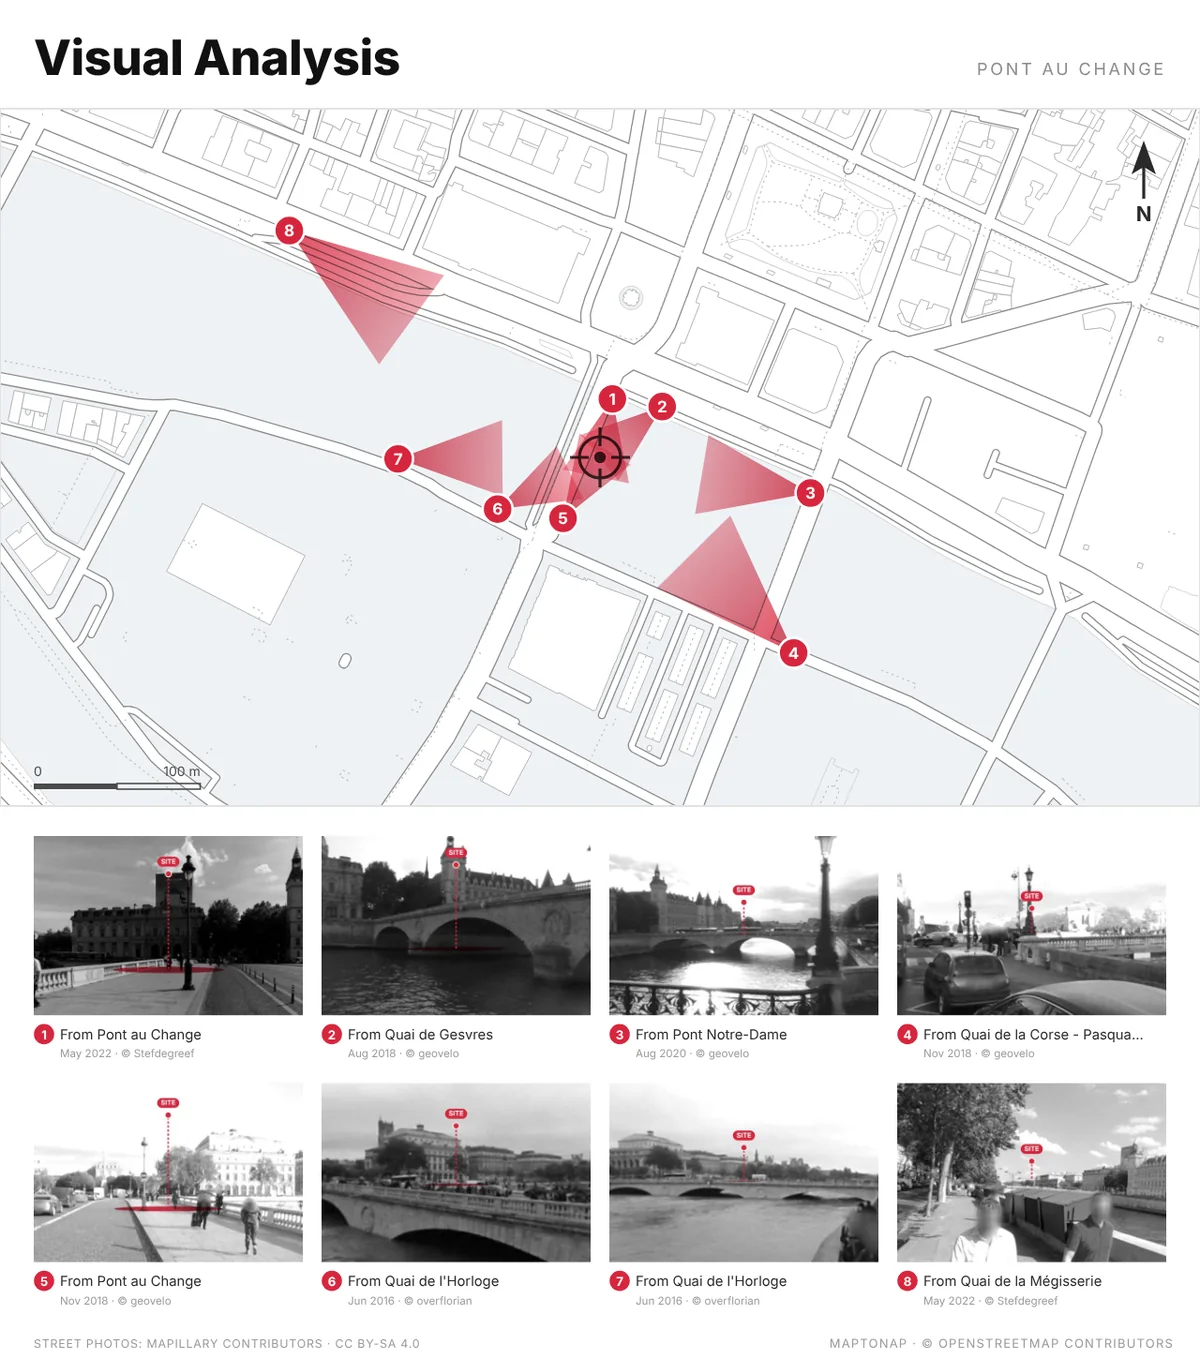
Yes. The Visual Analysis board (Max) draws numbered view cones on the plan and fills each with a real street-level photo from Mapillary, taken where the site can really be seen past the buildings in front, with the site picked out in red. The photos are CC BY-SA 4.0 and every photographer is credited on the board.
What is Deep Analysis?
Eight studies of the site that go beyond diagrams: 24 hours of real sun and shadow, walking isochrones, isovists and visibility graph analysis (VGA), the impact of a proposed design on sun, views and walking, the 15-minute city, an hour-by-hour footfall model, space syntax (how well each street is connected) and WHAT IF?, a 3D model of the real site where you change a building, close a street or add a block and measure what changes. It runs in your browser on real map data, is part of Max and is free to try on the Paris sample.
Can MapToNap simulate noise and wind around a site?
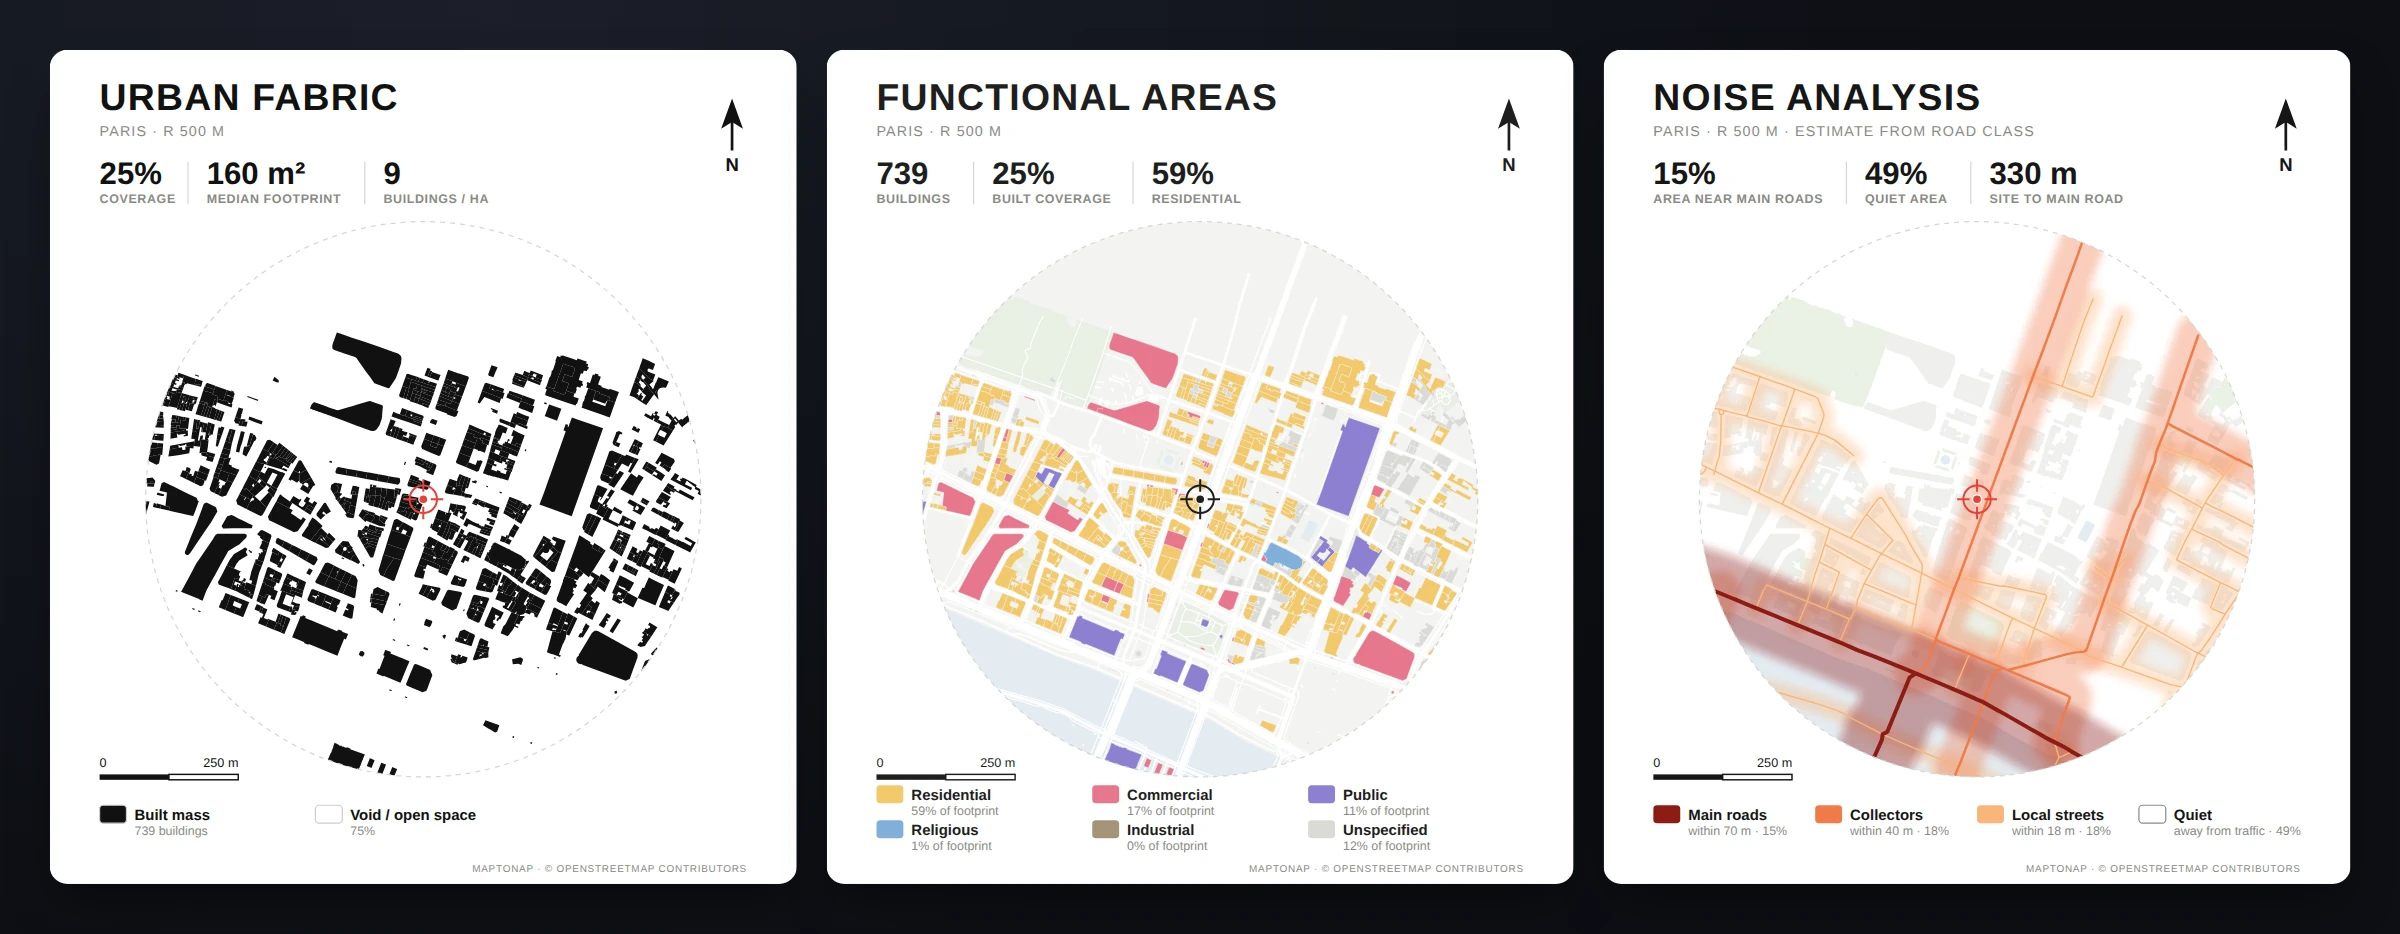
Yes, in Max. Road Noise · Aural Topography traces sound rays from every street and lets the buildings block them, drawn as 3 dB bands; the levels are estimated from road classes, not measured. Wind · Flow Simulation runs a 2D lattice Boltzmann simulation around the real buildings on your graphics card and marks the sheltered areas and wind corridors for a wind direction you choose. Both are computed in your browser; neither replaces an engineering noise or wind study.
What is a space syntax analysis, and can MapToNap make one?
Space syntax reads how each street sits in the network around it. MapToNap's Deep Analysis runs an angular segment analysis of the real street network and draws integration (the streets easiest to reach) and choice (the through-routes) at 400, 800 or 1200 m. It is free to try on the Paris sample. How the space syntax study works.
Can it simplify the buildings into blocks with street names?
Yes. Urban Fabric · Generalisation (Max) merges the buildings into blocks the way a cartographer would, joining neighbours within 2.5 m, filling small courtyards and simplifying the outlines, then places the street names automatically where they fit. In central Paris the drawing has about 70% fewer vertices than the raw footprints.
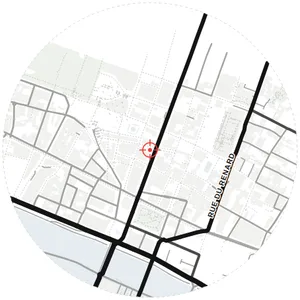 Roads & Streets
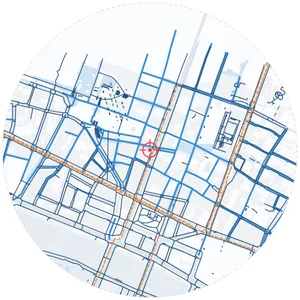 Pedestrian Network
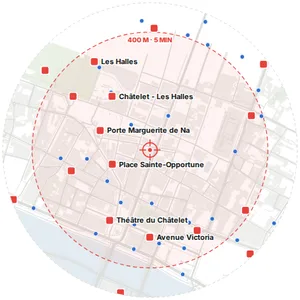 Transit Access
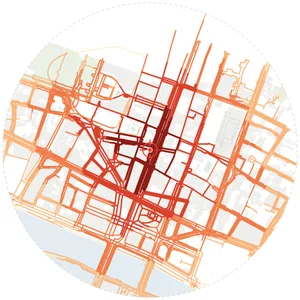 Access Analysis
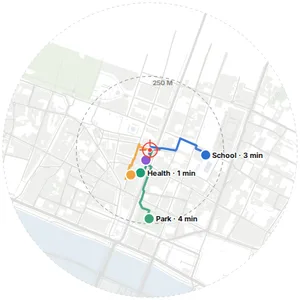 Walk Accessibility
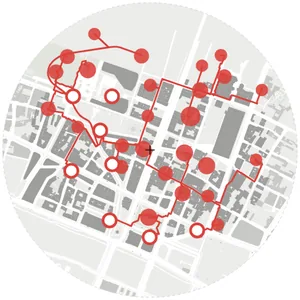 Stay Places & Connections
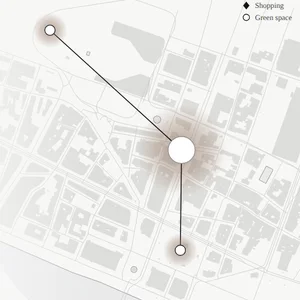 Central & Accessible
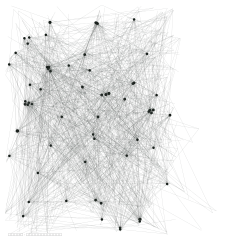 Street Connection Field
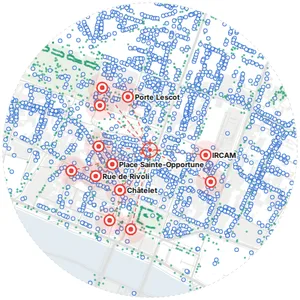 Node Analysis
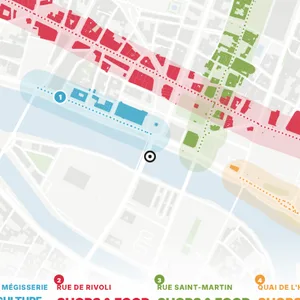 Street Corridors
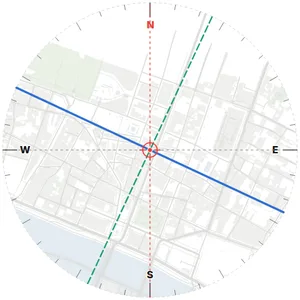 Orientation
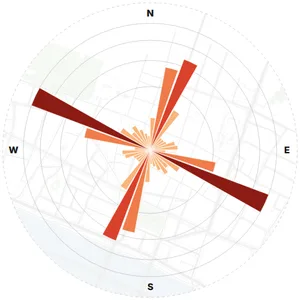 Orientation Rose
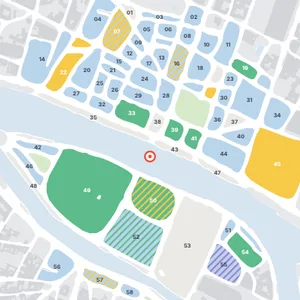
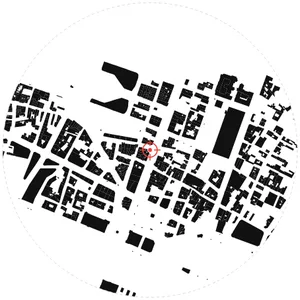 Urban Fabric
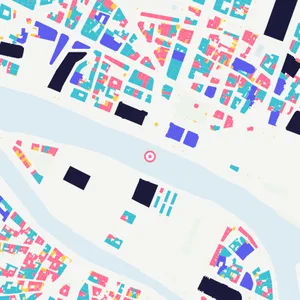 Urban Fabric · B
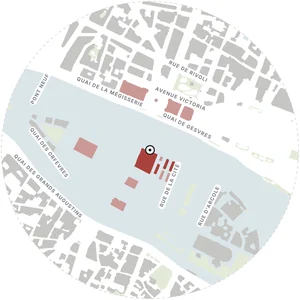 Urban Fabric · Generalisation
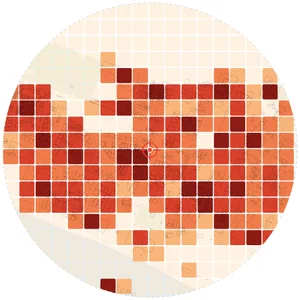 Building Density
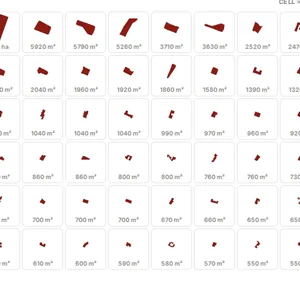 Building Typology
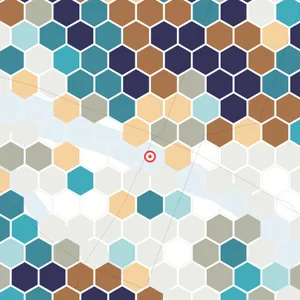 Bivariate Hex Grid
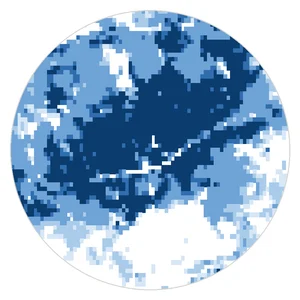 Urban Growth
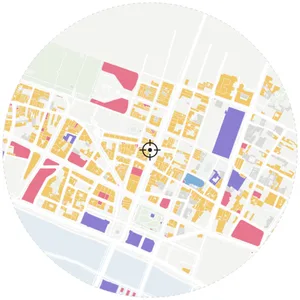 Functional Areas
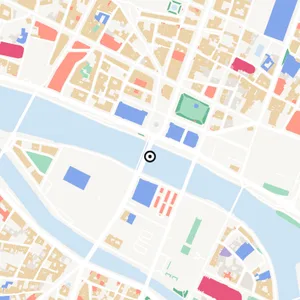 Functional Areas · B
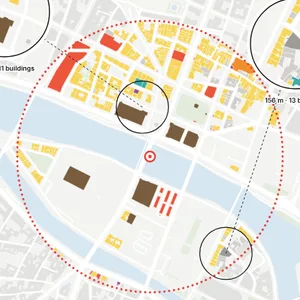 Building Uses
 Zoning Plan · B
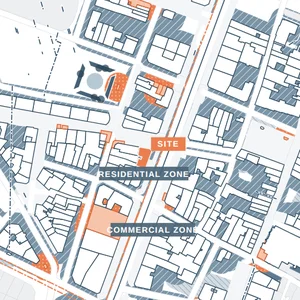 Zoning Plan
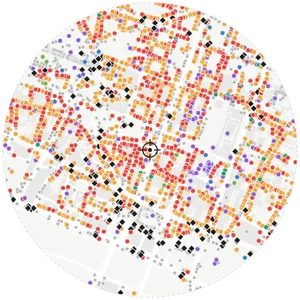 POI Type Map
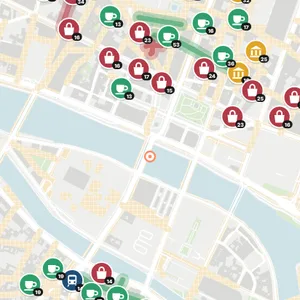 POI Type Map · B
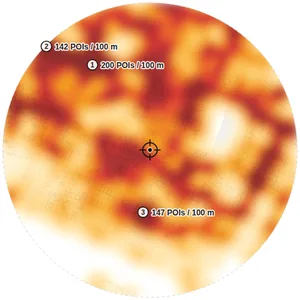 POI Density Heat
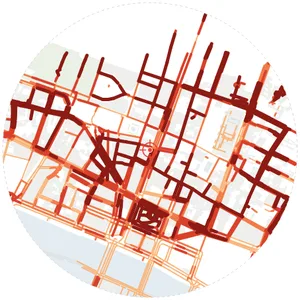 Street Vitality
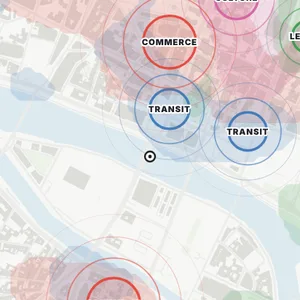 Activity Centres
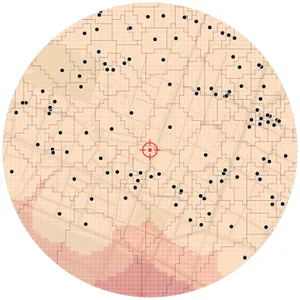 Service Territories
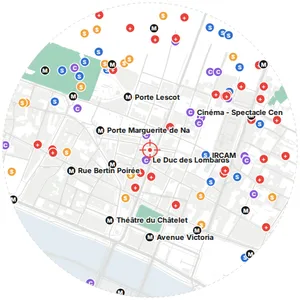 Annotated Map
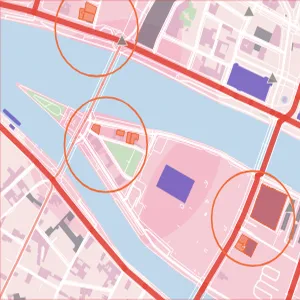 Places & Times
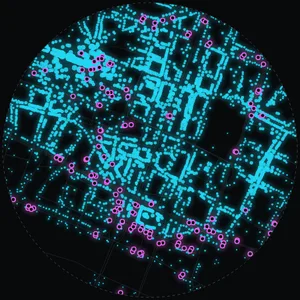 Urban Data · Nodes
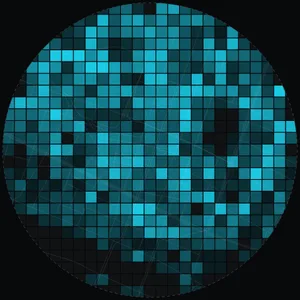 Urban Data · Grid
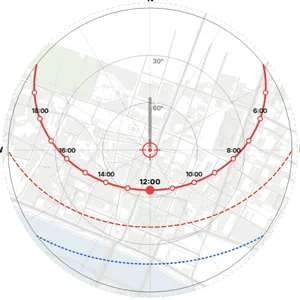 Sun Path
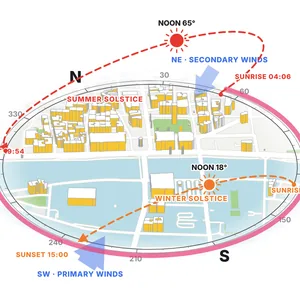 Sun & Wind Axonometric
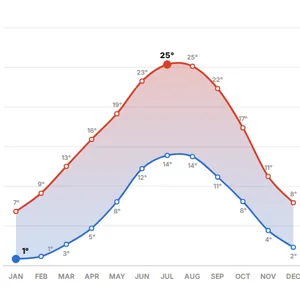 Temperature Year
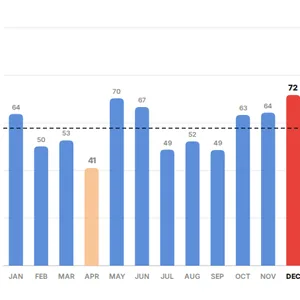 Precipitation Year
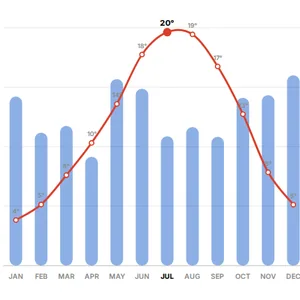 Annual Climate
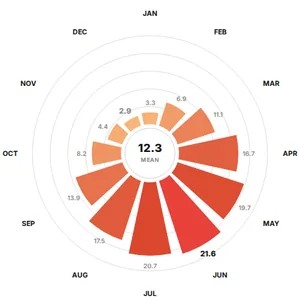 Solar Radiation
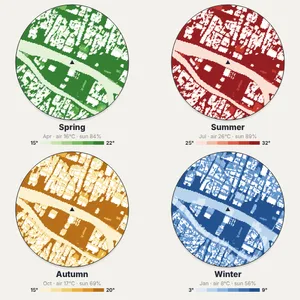 Four Seasons · 2 PM
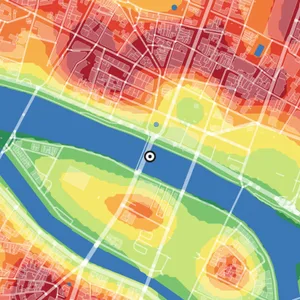 Urban Heat · Estimate
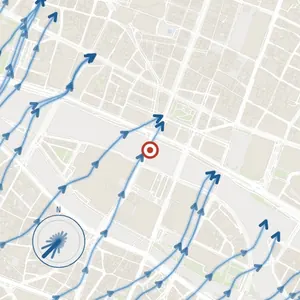 Wind Flow
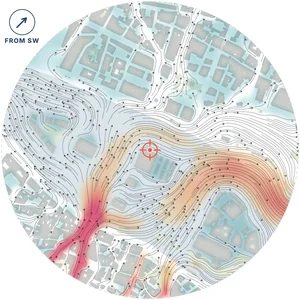 Wind · Flow Simulation
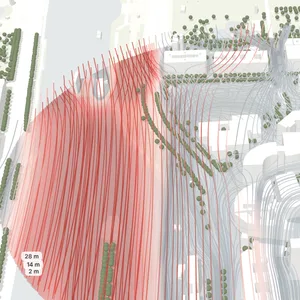 Wind · 3D Flow
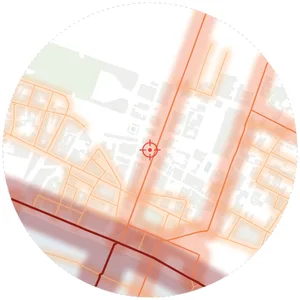 Noise Analysis
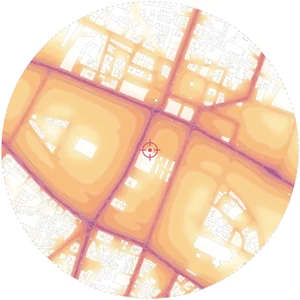 Road Noise · Aural Topography
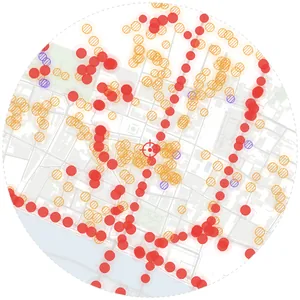 Sound Sources
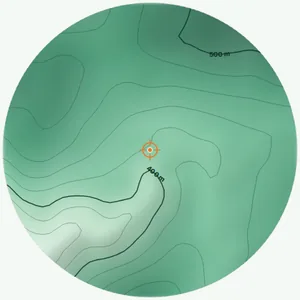 Topography
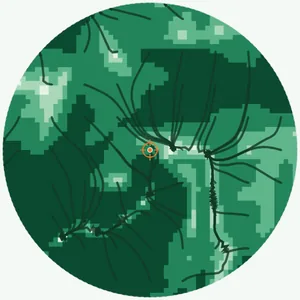 Slope & Drainage
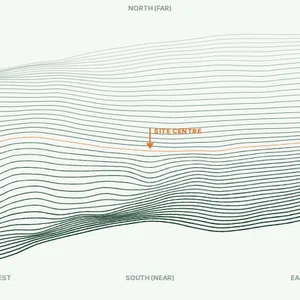 Terrain Wireframe
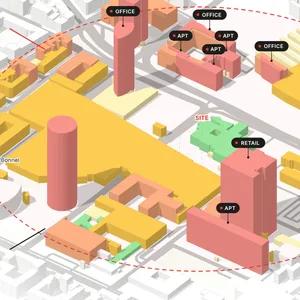 Urban Context Axonometric
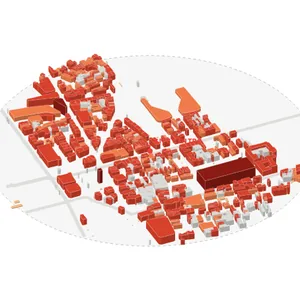 Isometric Massing
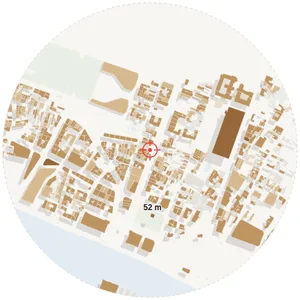 Building Massing
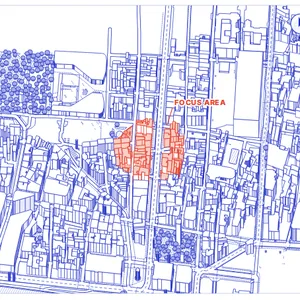 Line Axonometric
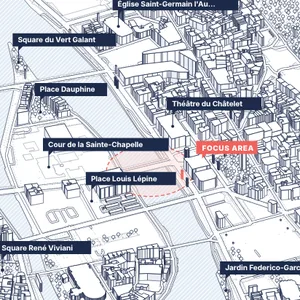 Line Axonometric · B
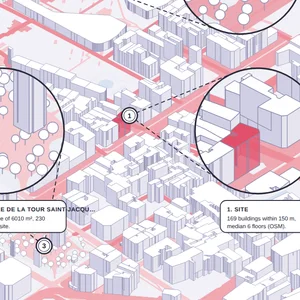 Axonometric Callouts
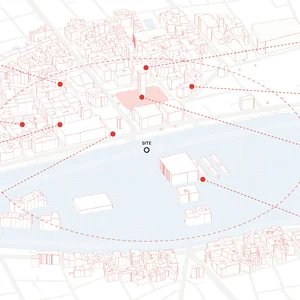 Active & Lost Spaces
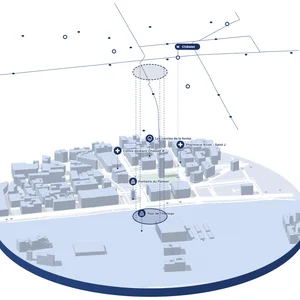 Transit Layers
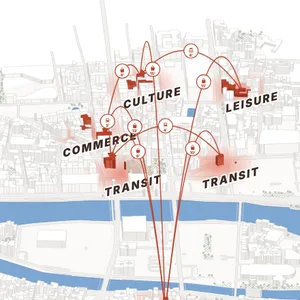 Centres & Connections
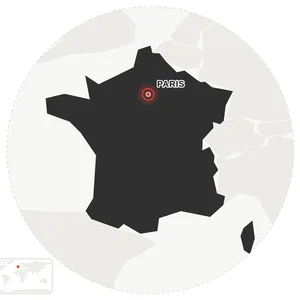 Location
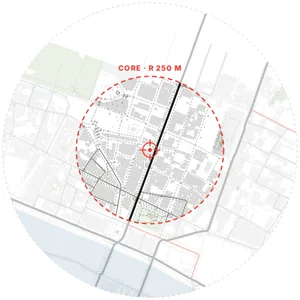 City Context
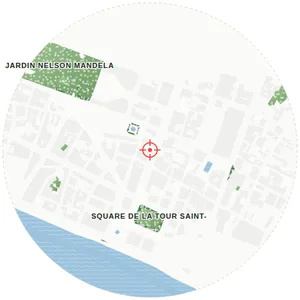 Green & Water
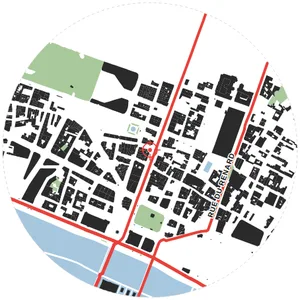 Combined Overlay
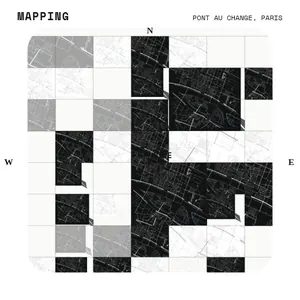 Context Mapping Board
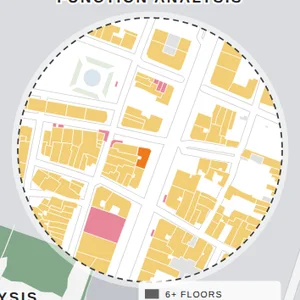 Site Inset Board
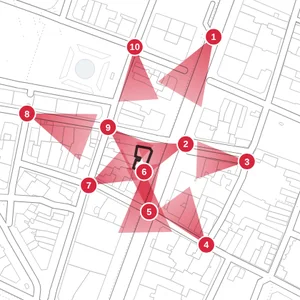 Visual Analysis
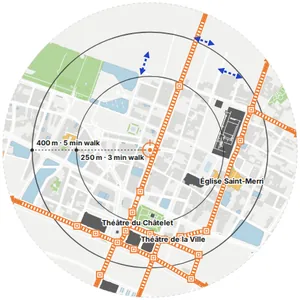 Opportunities & Constraints