Is GIS better than MapToNap?
For flexibility and data, yes. MapToNap is faster for the standard architecture drawings and needs no training.
Desktop GIS can make any map or spatial analysis if you learn it, and the leading programs are free and open source. MapToNap runs in the browser and draws a fixed set of site-analysis sheets from an address, in a style made for architecture boards. This page is written by the MapToNap team. We compare kinds of tool rather than named products, and describe each by what it does best.
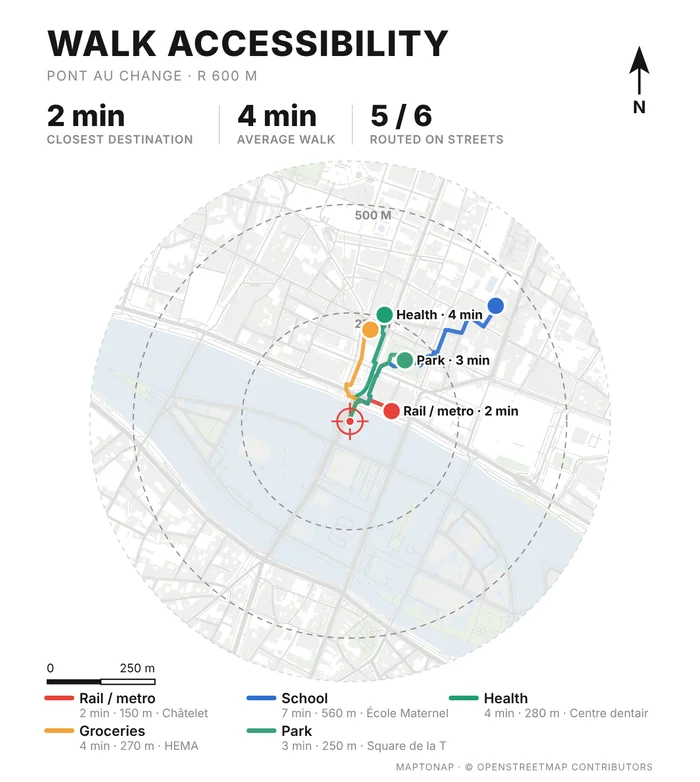
| Desktop GIS | MapToNap | |
|---|---|---|
| Core job | General-purpose GIS: any data, analysis and cartography | Site-analysis drawings for architecture |
| Skills needed | GIS basics: layers, projections, styling | None: pick a site and the analyses |
| Data | Whatever you load | OpenStreetMap, open terrain, climate and built-up records, fetched for you |
| Flexibility | Unlimited | 92 analyses with colour themes and custom legends |
| Typical pricing | Often free and open source | Four drawings free (watermarked, no sign-up); Pro €7.99 or Max €12.99 for 30 days, Max for a year €49. One-off passes, nothing renews. |
Checked 25 October 2026. The left column describes what tools of this kind typically offer; individual products differ, so check the one you are considering. Features and prices change.
1. Download an OpenStreetMap extract for the city, or query just the area you need. 2. Load the building, land use and road layers and set a projected coordinate system, so distances are in metres. 3. Clip everything to your study radius. 4. Classify buildings and land by their tags and pick a colour for each class. 5. Style the streets by class, then add a north arrow, scale bar and legend in the print layout. 6. Export a PDF or SVG and tidy it in your layout program. Every step is standard practice, and every step is something to learn the first time.
1. Type the address and set the radius. 2. Tick Land use. 3. Press Generate and download SVG, PDF or PNG. The legend, scale bar and north arrow are already on the sheet, and the next analysis you tick comes out in the same style. What you give up is control: the classes, the layout and the data source are fixed.
Generated in MapToNap from OpenStreetMap data. The same maps can be built in desktop GIS with the steps above.
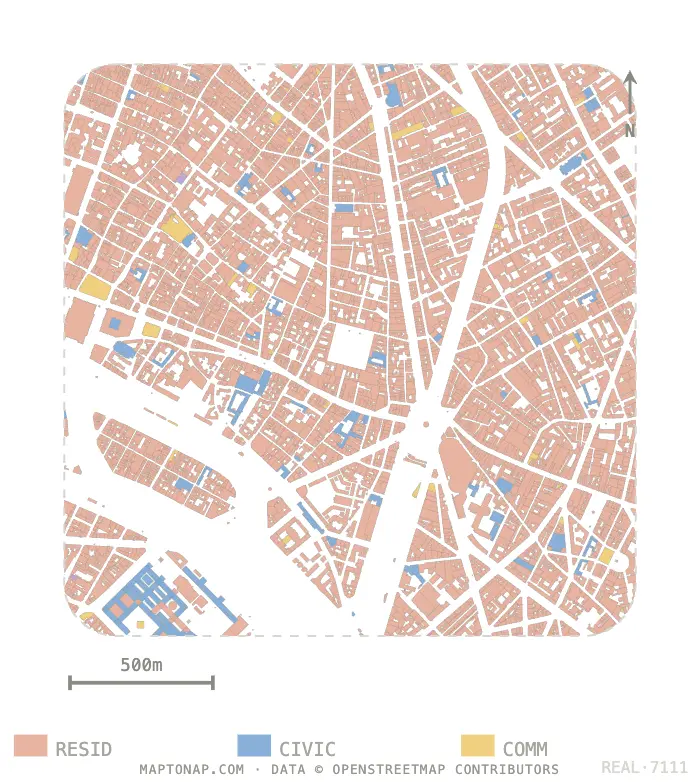
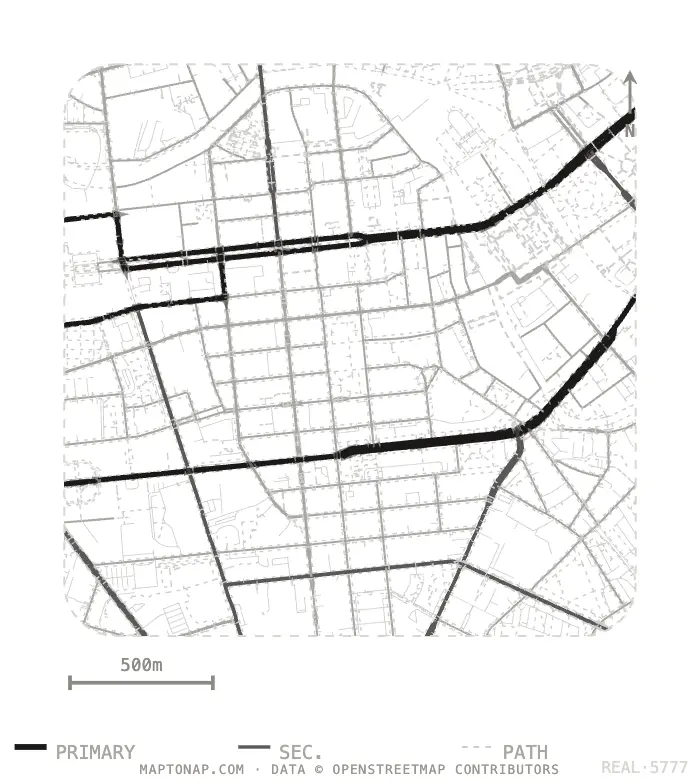
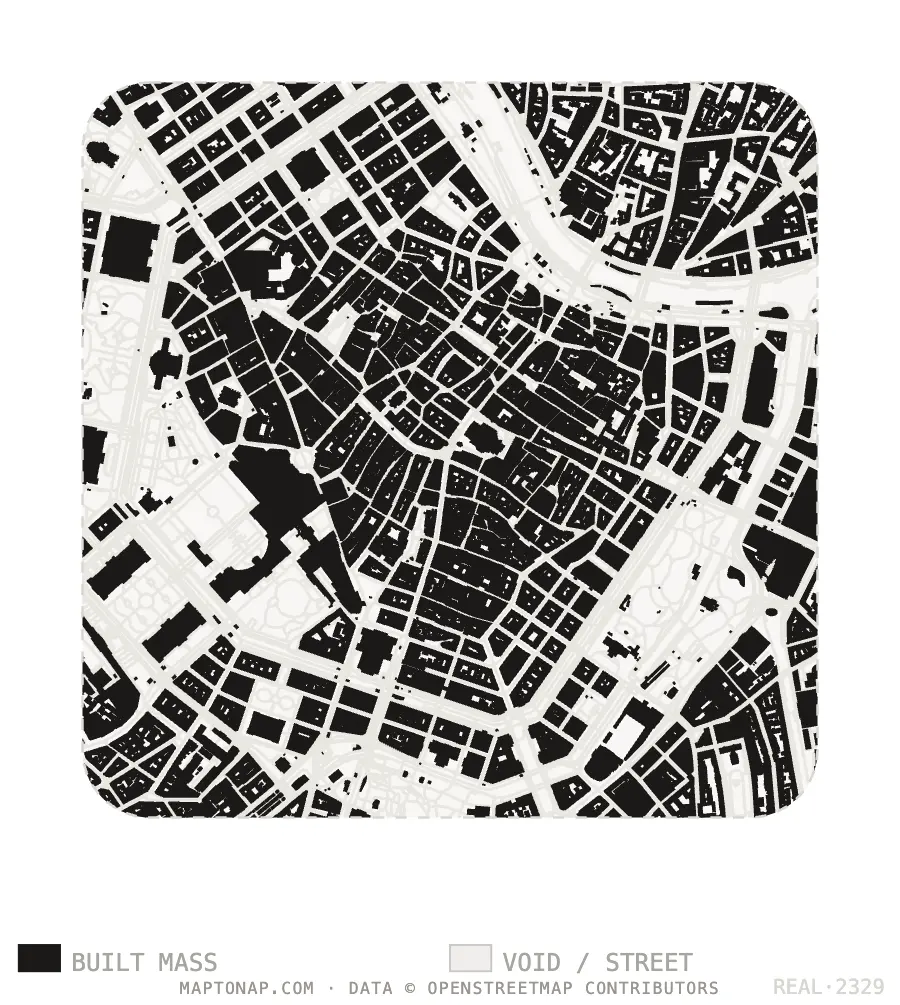
Map data © OpenStreetMap contributors, ODbL. Images are drawings generated in MapToNap.
You need official local data, a custom analysis or exact projections, and have time to learn.
You need a full set this week, in one style, without learning GIS.
Standard sheets in MapToNap; the one custom study in GIS.
Both can use OpenStreetMap, so outputs overlay.
MapToNap sheets sit next to GIS exports in your layout program.
Use the sheets as a checklist of what a site analysis should cover.
For flexibility and data, yes. MapToNap is faster for the standard architecture drawings and needs no training.
You can import Shapefile, GeoJSON and Chinese Tianditu data for sites where OpenStreetMap is thin.
No. MapToNap runs in the browser.
Four drawings are free; 30-day passes cover the rest.