Home / Site analysis / Landscape analysis
Landscape analysis

Landscape site analysis from real map data

Nine landscape drawings and one painted 3D site block for any address: where the trees and the shade are, how far it is to a park, which green patches connect, where rain can soak in, and what kind of open space surrounds the site. Every number comes from mapped data, and every drawing says when the data is thin.

9 landscape drawingsIllustrated 3D site block · 6 looksEditable SVG · PDF · PNGPart of Max
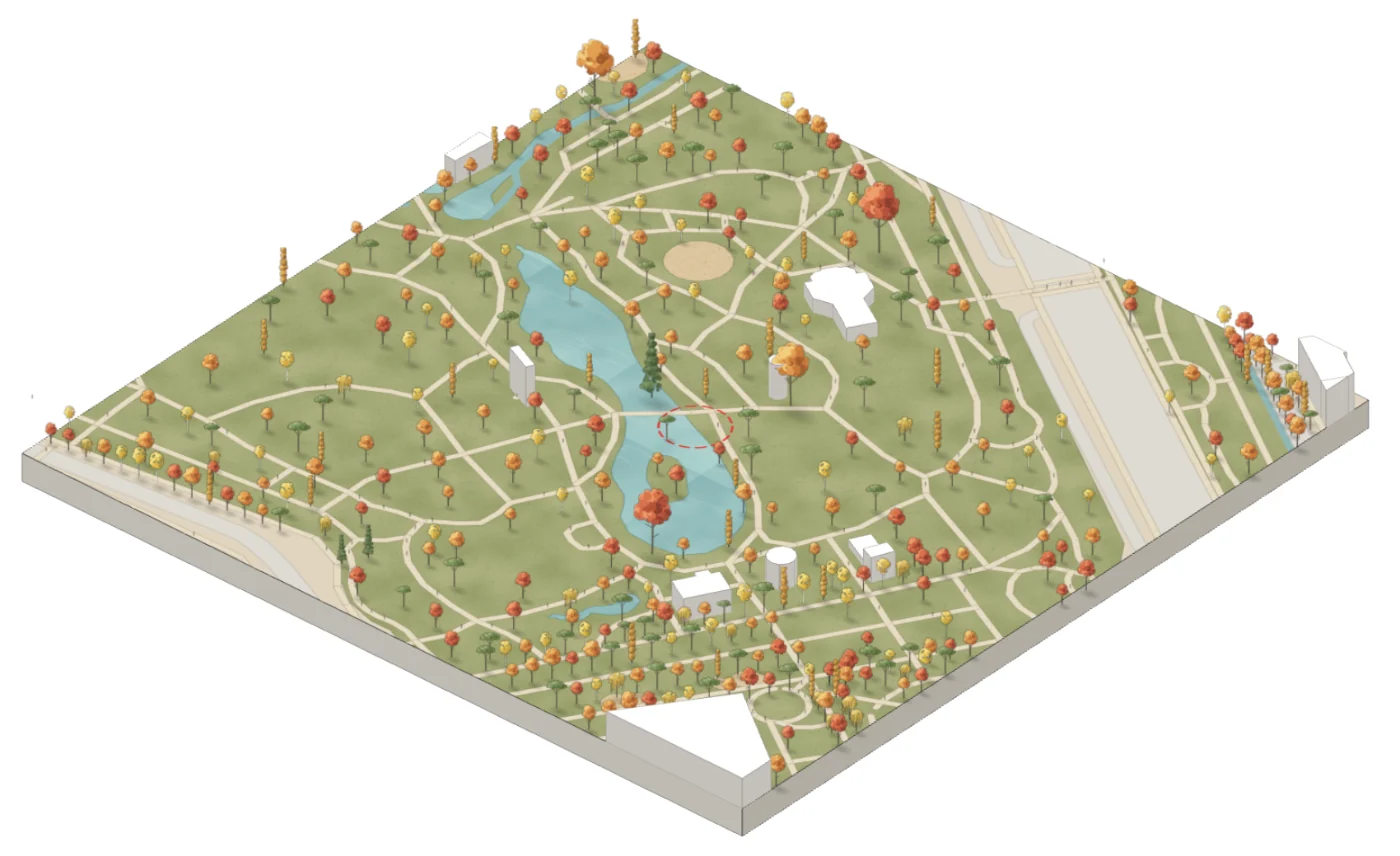
Illustrated axonometric site block of Giardini Indro Montanelli, Milan, in the autumn look, generated in MapToNap
What you can make

The drawings, and what each one shows

Tree Canopy & Shade

Mapped trees with their crowns, woodland, and the share of streets in shade. Where few trees are mapped, the drawing says the real canopy is likely larger.

Street Trees

Every street coloured by the share of its length with trees along it, with the greenest streets listed.

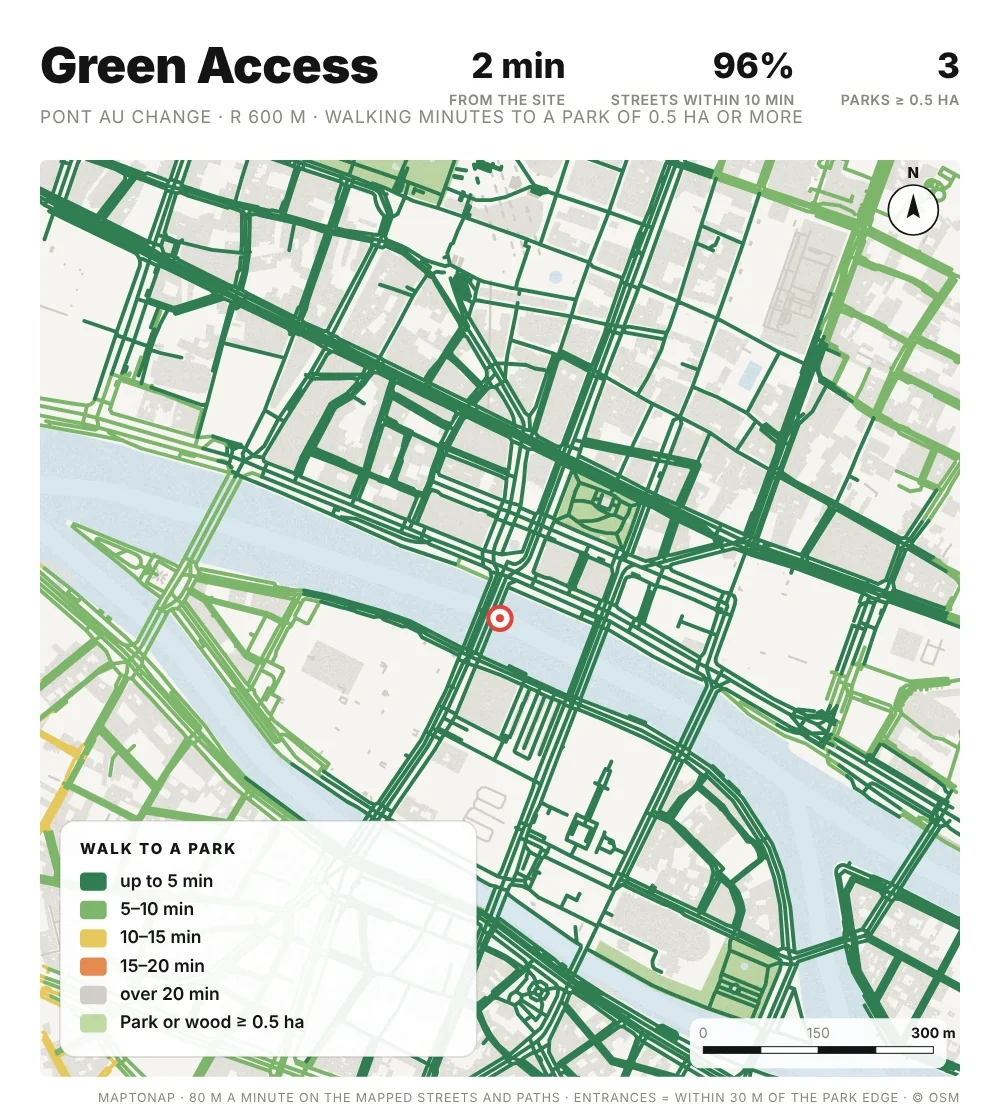
Green Access

Walking minutes from every street to a park of 0.5 ha or more, and the share of streets within ten minutes.

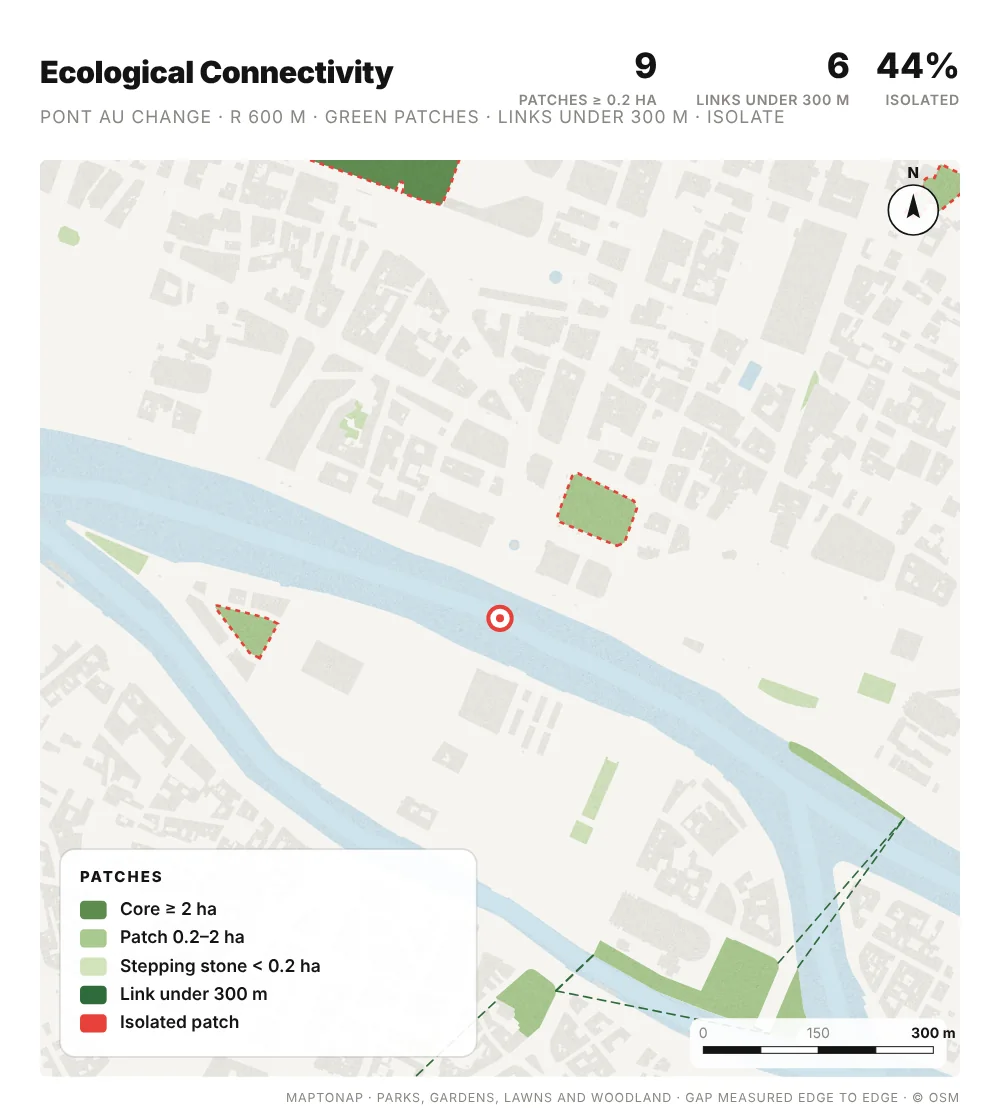
Ecological Connectivity

Green patches by size, the links between them under 300 m, and the patches left isolated.

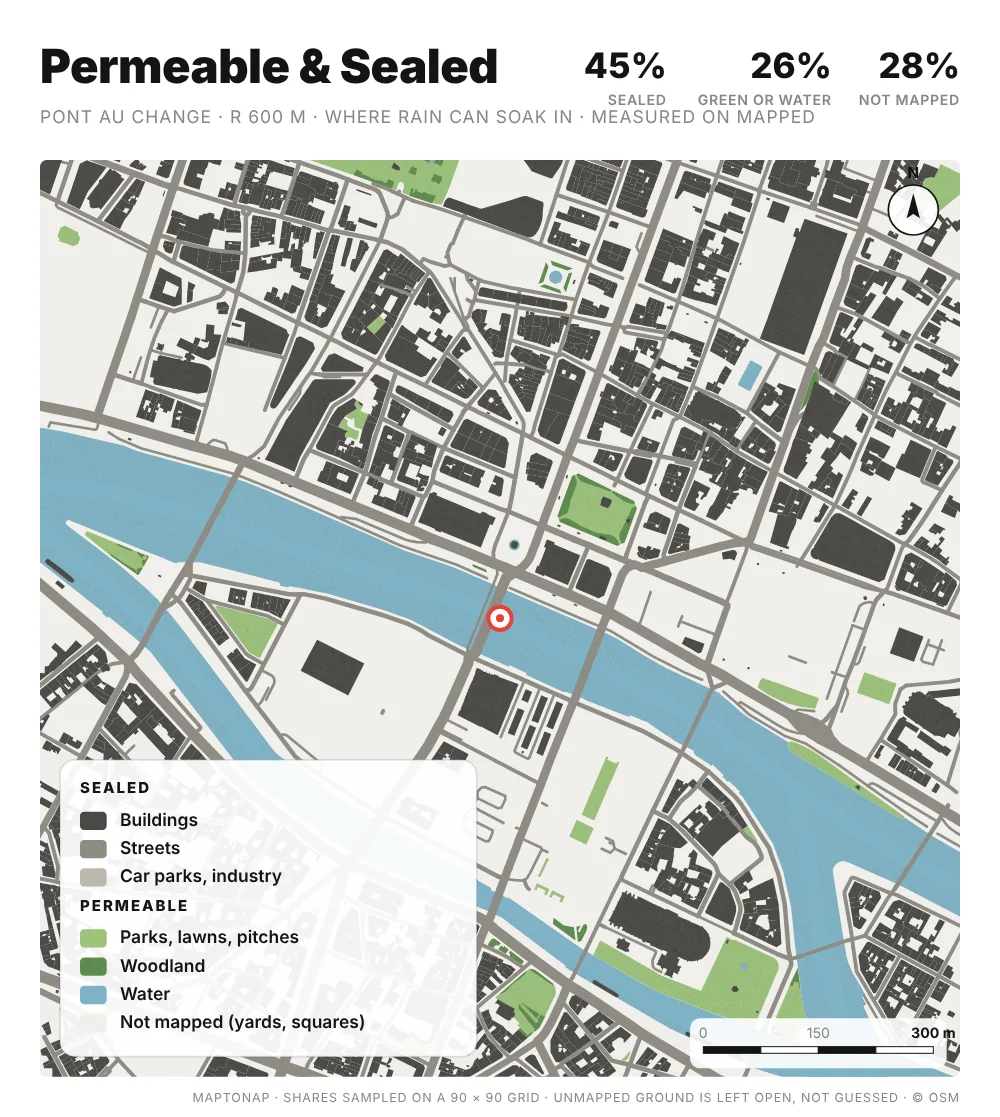
Permeable & Sealed

Where rain can soak in and where the ground is sealed, measured on mapped surfaces, with the unmapped share stated.

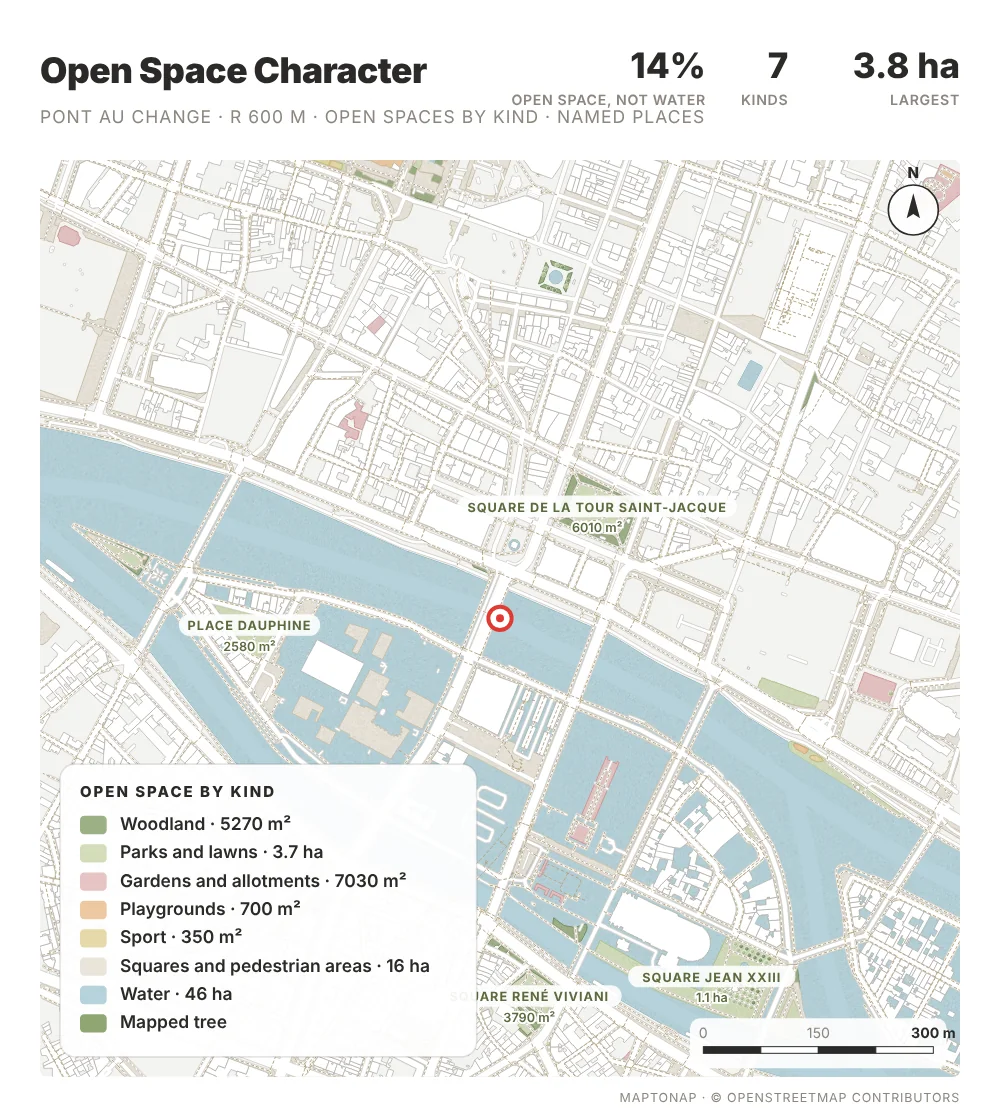
Open Space Character

Parks, woods, gardens, play, sport, squares and water by area, with the named places labelled.

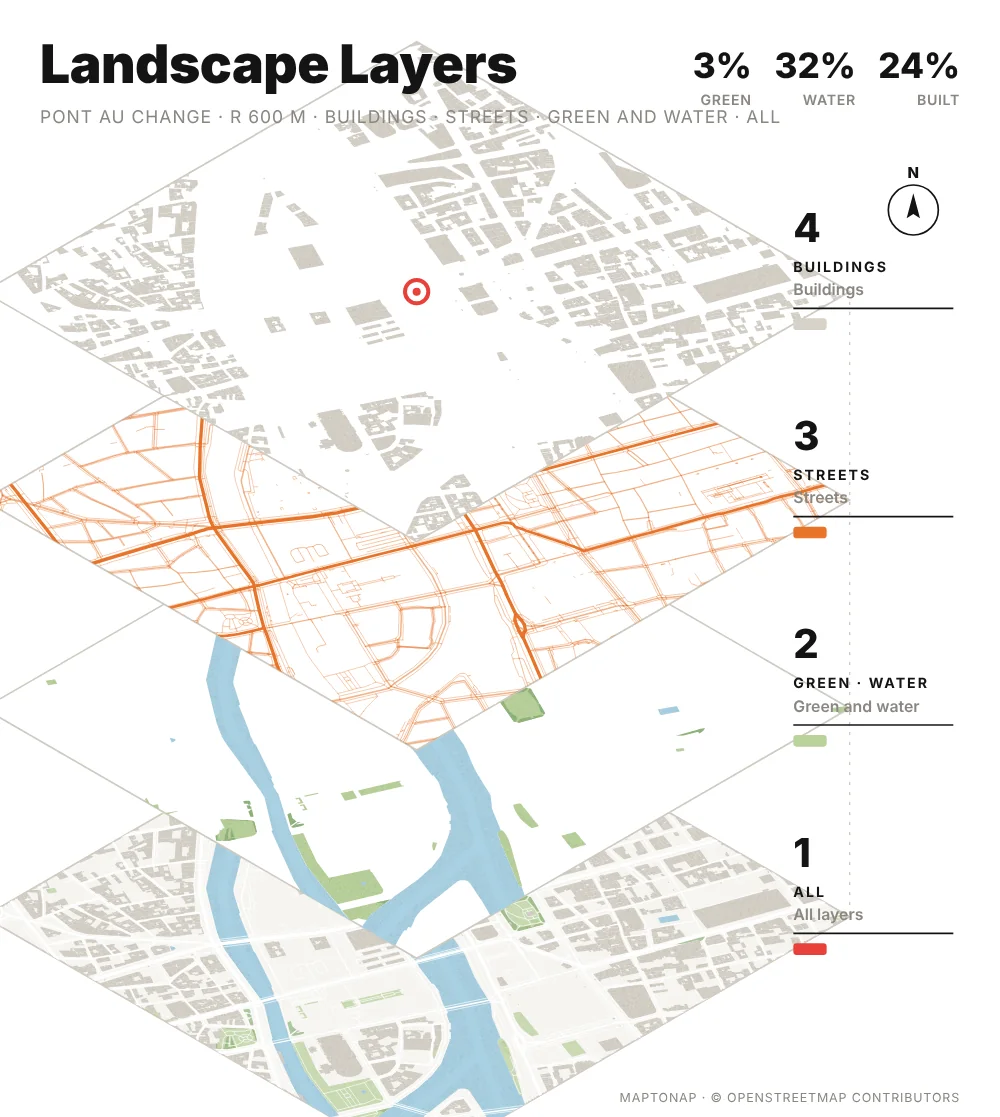
Landscape Layers

An exploded axonometric of buildings, streets, and green and water, with the share of each.

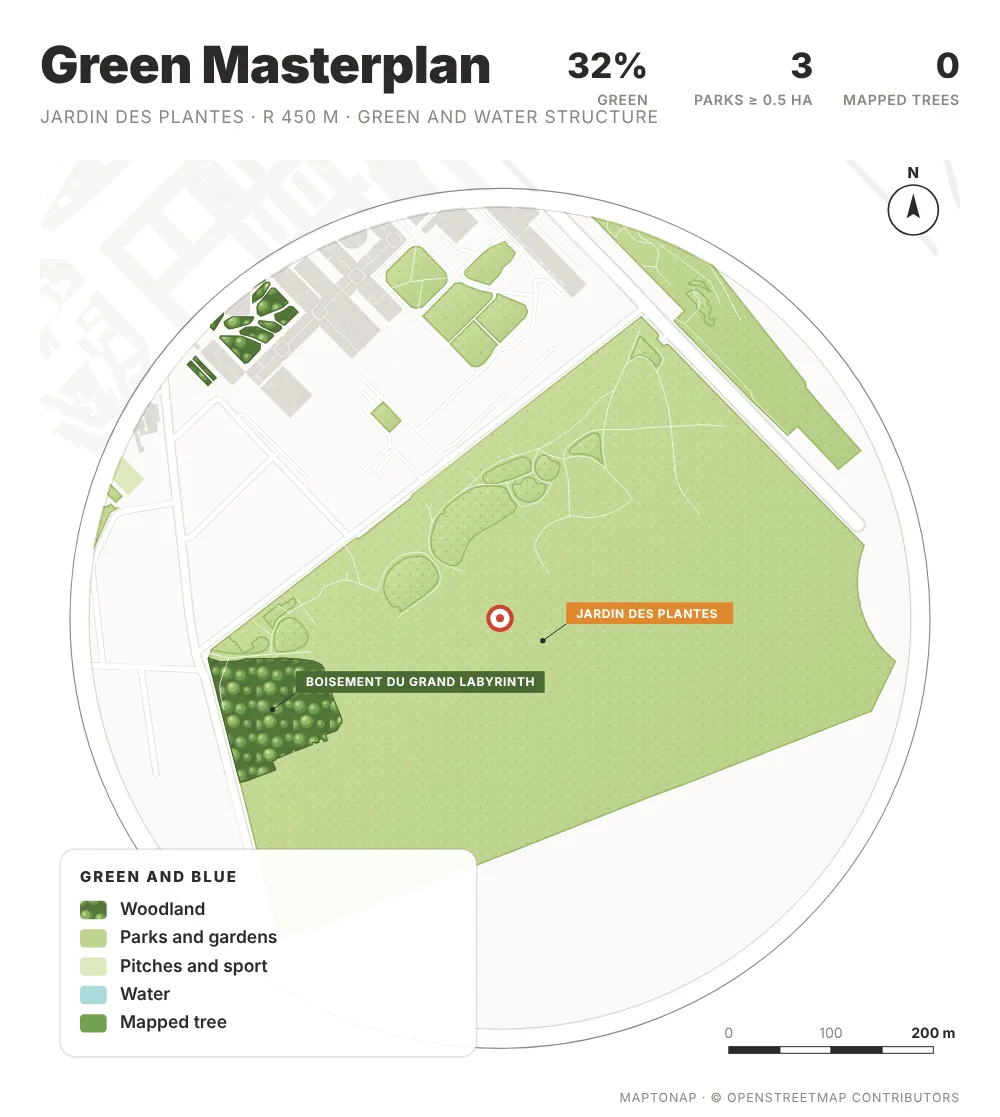
Green Masterplan

A circular plan with painted greens and water: the green and blue structure around the site.

Tree Species

Mapped trees by genus and the share of the most common, or by leaf type where species are not tagged.

Illustrated Site Block (3D)

A painted axonometric block at real building heights, in six looks: Summer, Spring, Autumn, Soft, Foam model and Sketch. Trees drawn in where few are mapped are marked as illustration.

Guide

How to make a landscape site analysis

  1. Start from the green structure. Draw what is already there, parks, woods, water, street trees, before any proposal. The Green Masterplan and Open Space Character drawings show it at a glance.
  2. Measure access, not only area. A park only serves the people who can walk to it. Green Access shows walking minutes from every street, so the gaps are visible.
  3. Look at links. Ecological value depends on how patches connect. Ecological Connectivity marks the links under 300 m and the isolated patches a design could reconnect.
  4. Show the ground. Permeable and sealed ground decides where rain goes. Use it to argue for depaving, rain gardens or new planting.
  5. Say what the data covers. Trees and surfaces are only as complete as the map. MapToNap states mapped and unmapped shares on each drawing; keep those notes on the board.
Frequently asked questions

Before you start

Which landscape drawings does MapToNap make?

Nine 2D drawings: Tree Canopy & Shade, Street Trees, Green Access, Ecological Connectivity, Permeable & Sealed, Landscape Layers, Green Masterplan, Open Space Character and Tree Species; and one 3D drawing, the Illustrated Site Block. All ten are part of Max.

Where do the trees come from?

From trees and tree rows mapped in OpenStreetMap. Mapping is uneven: some cities map almost every street tree, others very few. When few trees are mapped, the drawings say so instead of guessing, and the Illustrated Site Block marks any trees it draws in as illustration, not survey.

Can I change the look of the 3D site block?

Yes. The Illustrated Site Block has six looks, Summer, Spring, Autumn, Soft, Foam model and Sketch, and switching between them takes about a second.

Can I change how the drawings look?

Yes. Every landscape drawing has several looks. The default looks are drawn like landscape competition boards: the Green Masterplan as a white ring with woods drawn as crowns and named places on tags, Tree Canopy as an atlas with drawn crowns, Tree Species as density bubbles, Open Space as a lime poster with pictograms and a magnifier on the site. The earlier flat colour looks are still there.

Does it work outside Europe?

Yes, anywhere OpenStreetMap has data. In cities where little is mapped, such as many Chinese cities, the drawings show what is mapped and say where it is incomplete.

Is it free?

You can try MapToNap free: four 2D drawings (roads, land use, green and water, urban fabric) and one 3D drawing, with a watermark and no sign-up. Without the watermark and with all 92 analyses there are one-time passes: Pro €7.99 or Max €12.99 for 30 days, or a year of Max for €49. Nothing renews automatically.

Do I need to install anything? Does it work on a phone?

No installation and no setup. MapToNap runs in the browser on any computer, tablet or phone, iPhone or Android: open maptonap.com/app, type an address and press Generate. 3D drawings and simulations run smoothest on a computer.
Related

Keep going