Product
Browser-based site analysis and diagram toolkit for architecture, urban design and landscape
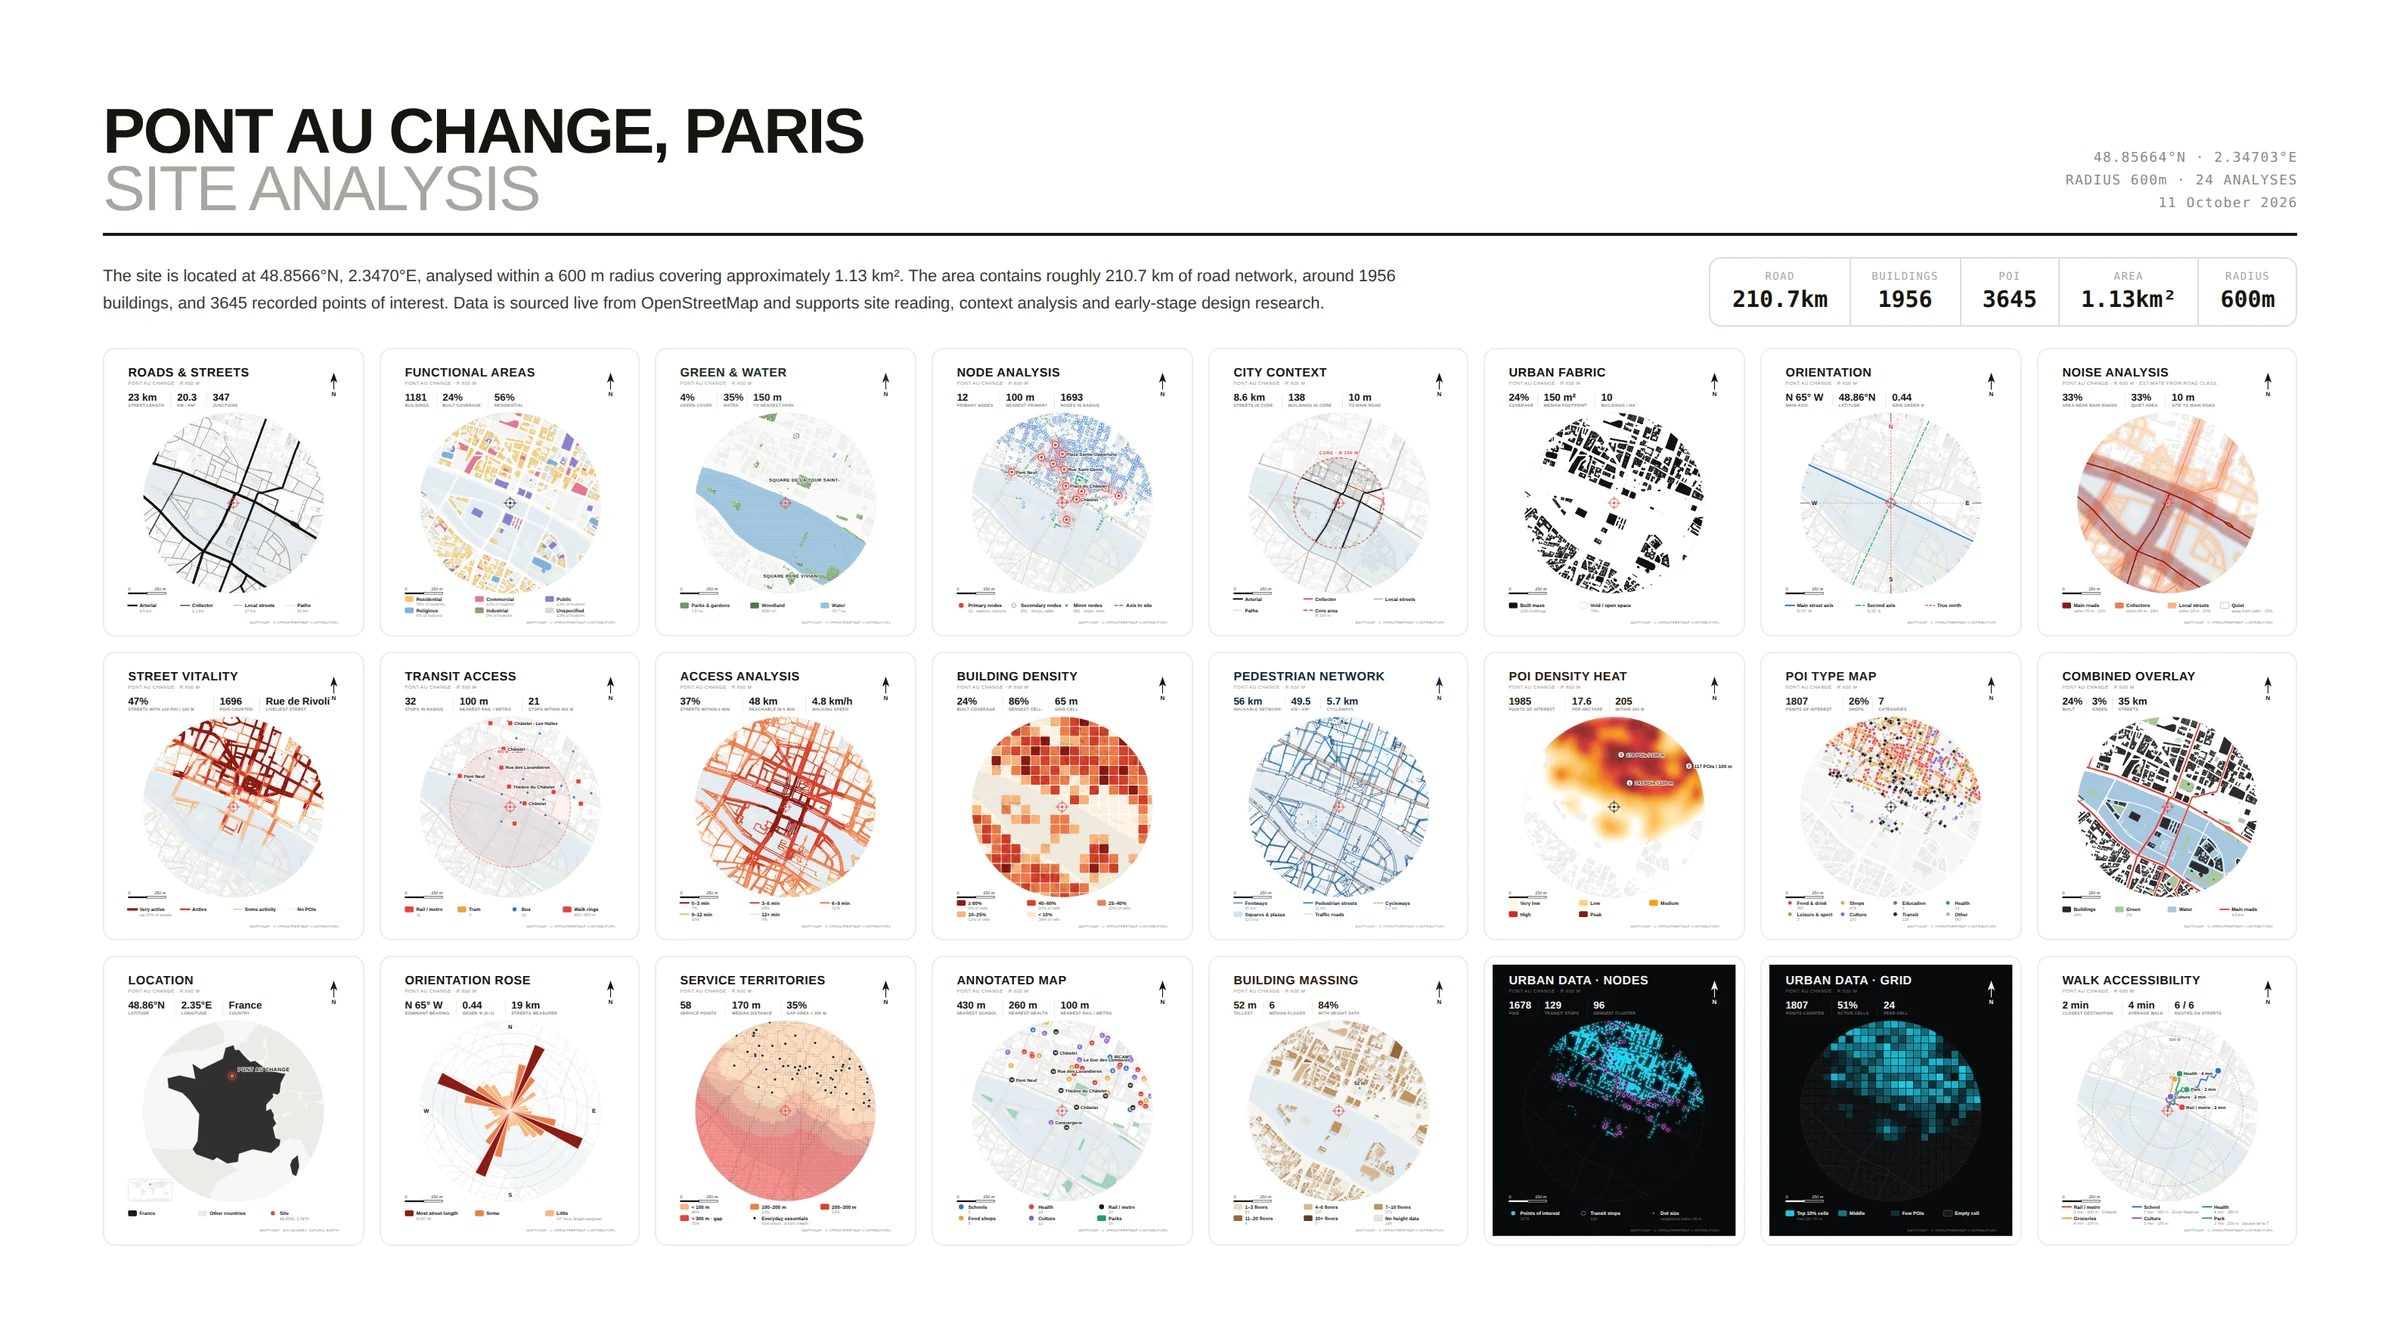
MapToNap is a browser-based site analysis toolkit for architects and architecture students. Drop a pin on any address and it draws up to 92 site analysis diagrams from real open data as editable vectors, and builds a 3D site model you can export to Rhino 3DM, OBJ or GLB. It does not use AI image generation.
Browser-based site analysis and diagram toolkit for architecture, urban design and landscape
MapToNap, an independent tool. Formerly EasyMap (easymap.uk)
Architecture and urban design students, architects, planners and landscape designers
92 site analysis diagrams (one is a visual analysis with real street photos; fourteen are drawn in 3D, among them an urban context axonometric, wind streamlines at 2, 14 and 28 m, an active and lost spaces axonometric and a transit layers drawing), a 3D site model, eight Deep Analysis studies, and concept, strategy, flow, bubble, plan and elevation drawings
PNG, editable SVG, vector PDF, A3 report; 3D: Rhino 3DM, OBJ, GLB; floor plans: DXF
OpenStreetMap; NASA POWER climate; Terrain Tiles elevation (SRTM, USGS, EU-DEM); Mapillary street-level photos (CC BY-SA 4.0) for the visual analysis
None. Drawings come from data and editable geometry
Free: 4 analyses and 1 3D drawing, with watermark · Pro €7.99 / 30 days · Max €12.99 / 30 days · Max 1 year €49. One-time payments, no subscription
Any modern browser on desktop or tablet; no install, no account
Website: English, Spanish, Chinese. App: English, Chinese
Eight studies in Max: 24 hours of real sun and shadow, walking isochrones, isovists and VGA, design impact on sun, views and walking, the 15-minute city, hour-by-hour footfall, space syntax and WHAT IF? (change a building, a street or add a block in a 3D model of the real site). Each one ends with its results: key numbers, charts, conclusions written from the numbers and a downloadable A3 findings sheet. Free to try on the Paris sample
Worldwide, wherever OpenStreetMap has data
Listed among the recommended urban design tools in the EUSAFE Digital Toolkit of the Faculty of Architecture, University of Ljubljana
Because the people who make architecture deserve rest. Architecture students and architects work through nights before reviews and spend weekends tracing base maps, and long hours are often treated as proof of commitment. MapToNap gives those hours back, and wants more people, inside and outside the profession, to see how hard architects work and to take their rest and health seriously. From map to nap
A share of every purchase funds permanent carbon removal. Drawings are computed in your browser, with no render farm
Yes, in Max. Road Noise · Aural Topography traces sound rays from every street and lets the buildings block them, drawn as 3 dB bands; the levels are estimated from road classes, not measured. Wind · Flow Simulation runs a 2D lattice Boltzmann simulation around the real buildings on your graphics card and marks the sheltered areas and wind corridors for a wind direction you choose. Both are computed in your browser; neither replaces an engineering noise or wind study.
Space syntax reads how each street sits in the network around it. MapToNap's Deep Analysis runs an angular segment analysis of the real street network and draws integration (the streets easiest to reach) and choice (the through-routes) at 400, 800 or 1200 m. It is free to try on the Paris sample. How the space syntax study works.
Because the people who make architecture deserve rest. Studying and practising architecture often means all-nighters before reviews, weekends spent tracing base maps and long hours treated as proof of commitment. MapToNap draws the base maps and site analysis for you so those hours go back to design, friends and sleep, and it wants more people, inside and outside the profession, to see how hard architects and architecture students work and to take their rest and health seriously.
Yes. 14 of the 92 analyses are drawn in 3D from real building heights. The Urban Context Axonometric shows the city around the site as a 3D model coloured by floors, with uses and two sections, and is free with a watermark. Wind · 3D Flow (Max) draws wind streamlines at 2, 14 and 28 m around the real buildings for a chosen wind direction; it is a 2D flow model run at three heights, not an engineering wind study.
WHAT IF? is a Deep Analysis study in a turnable 3D model of the real site, with live shadows. Change one thing, such as a building's number of floors, removing a building, closing a street or drawing a new block, and it measures what changes: hours of sun lost and gained on the ground and on neighbouring facades, walking detours and shortcuts, whether the street network splits, and the views from the public space around. Two scenarios, A and B, can be compared side by side and saved as a PNG board. It works for any address and is free to try on the Paris sample.
Architecture and urban design students who need a full site analysis board for a studio review or thesis, fast and in one consistent graphic style. Architects preparing competition entries, feasibility studies or client presentations who want editable vector diagrams of a real site, not traced screenshots. Anyone who needs analyses that usually take GIS skills (space syntax, visibility graphs, walking isochrones, sun hours) without installing or learning GIS. Projects anywhere in the world, including places where no official city data can be downloaded.
Surveyed boundaries, legal cadastral data or engineering-grade noise, wind or daylight certification: MapToNap draws from open map and climate data and says so on every sheet. Photorealistic AI renderings: it does not generate images. Detailed BIM modelling: it exports a context model to Rhino, OBJ and GLB for you to design in.
Roads & streets, urban fabric (figure-ground), land use, building density, building typology, location, city context, orientation, annotated map, context mapping board, fabric generalisation with automatic street labels, and a visual analysis board with numbered view cones and real street photos
Pedestrian network, walk accessibility, transit access, access analysis, street vitality, node analysis, service territories, POI density and POI type maps
Green & water, sun path & wind, wind flow, noise and sound sources, road noise topography (sound rays with building shielding), wind flow simulation (2D lattice Boltzmann), annual temperature, precipitation, sun & wind axonometric (solstice sun paths, sunlit facades, prevailing winds), solar radiation, annual climate
Topography, slope & drainage, terrain wireframe, building massing, isometric massing, and a full 3D site model with buildings, terrain, roads, water and trees
Site to Design (Max, new): after the analysis, mark the real plot on the map and pick one of 17 building types. MapToNap reads the site (what each edge faces, noise, sun, transit, green), sizes a programme bubble diagram to the plot, then draws the site story, the circulation on the real street network and a parametric concept, each with the site fact behind it: five linked drawings and the boards in one click, in one look for the whole set, each editable on the page. It lays them out as an A1 board, an editable PowerPoint with text, or A3 sheets.
Parametric Lab (Max, new): parametric zoning, grown networks and bubble diagrams solved on your real plot, with live sliders, variants and measured results.
Max also opens four design tools in the same workspace: Design Studio (site concept, site strategy and concept lab), bubble diagrams, flow diagrams and floor plan / axonometric.
Deep Analysis (Max) goes past diagrams with eight studies computed in the browser: a day in the site (real sun, shadows and open hours, with a map of sun hours), walk pulse (walking isochrones on the real streets), sightlines (isovists and visibility graph analysis), design impact (draw blocks and see the sun, views and walks they take from the neighbours), the 15-minute city (minutes on foot to eight daily needs on every street), footfall (an hour-by-hour estimate of people on each street) and space syntax (integration and choice of every street). Try it on the Paris sample.
MapToNap is a browser-based site analysis and diagram toolkit for architecture students, architects and urban planners. You choose a site on a map and it draws up to 92 site analysis diagrams from real open data as editable vectors, and builds a 3D site model you can export to Rhino 3DM, OBJ or GLB.
MapToNap is an independent tool for architects, landscape architects, planners and students. Its diagrams follow the conventions used on real review and competition boards.
Partly. Four analyses (roads, land use, green and water, figure-ground) and one 3D drawing, the Urban Context Axonometric, are free with a watermark and no sign-up. Pro costs €7.99 for a 30-day pass and Max €12.99 for a 30-day pass or €49 for a full year. Passes are one-time payments and never renew automatically.
No. Every drawing is built from map data, open climate and elevation data and rule-based, editable geometry. Nothing is generated by an image model, so the drawing matches the real site.
Buildings, streets, land use, water and points of interest come from OpenStreetMap. Climate data (sun, wind, temperature, rainfall, solar radiation) comes from NASA POWER. Elevation comes from Terrain Tiles on AWS Open Data (SRTM, USGS, EU-DEM). Street-level photos in the visual analysis come from Mapillary (CC BY-SA 4.0).
CAD export tools give you raw linework of an area to draw over in CAD. MapToNap draws finished analysis diagrams (land use, sun path, noise, transit access and more) in one graphic style, ready for a presentation board, and also exports a 3D site model. Many students use both.
No. MapToNap runs in a modern web browser on desktop or tablet. Projects are saved in your browser; an account is not needed. Paid licences are restored with a licence code.
Any place with OpenStreetMap data, which covers the whole world, including Latin America, Europe, Turkey, the Middle East and Asia. The level of detail depends on how well the area is mapped.
Yes. Paid plans include commercial use for your own projects, clients and publications. Keep the "© OpenStreetMap contributors" attribution on map-based drawings.
Yes. The Visual Analysis board (Max) draws numbered view cones on the plan and fills each with a real street-level photo from Mapillary, taken where the site can really be seen past the buildings in front, with the site picked out in red. The photos are CC BY-SA 4.0 and every photographer is credited on the board.
Eight studies of the site that go beyond diagrams: 24 hours of real sun and shadow, walking isochrones, isovists and visibility graph analysis (VGA), the impact of a proposed design on sun, views and walking, the 15-minute city, an hour-by-hour footfall model, space syntax (how well each street is connected) and WHAT IF?, a 3D model of the real site where you change a building, close a street or add a block and measure what changes. It runs in your browser on real map data, is part of Max and is free to try on the Paris sample.