What is a bubble diagram in architecture?
A bubble diagram is an early design tool that represents spaces as abstract shapes to study adjacency, hierarchy and circulation before exact planning.
Bubble Diagram turns a list of spaces and relationships into a visual program study. Use it to explore adjacency, clustering and hierarchy before committing to walls and exact geometry.
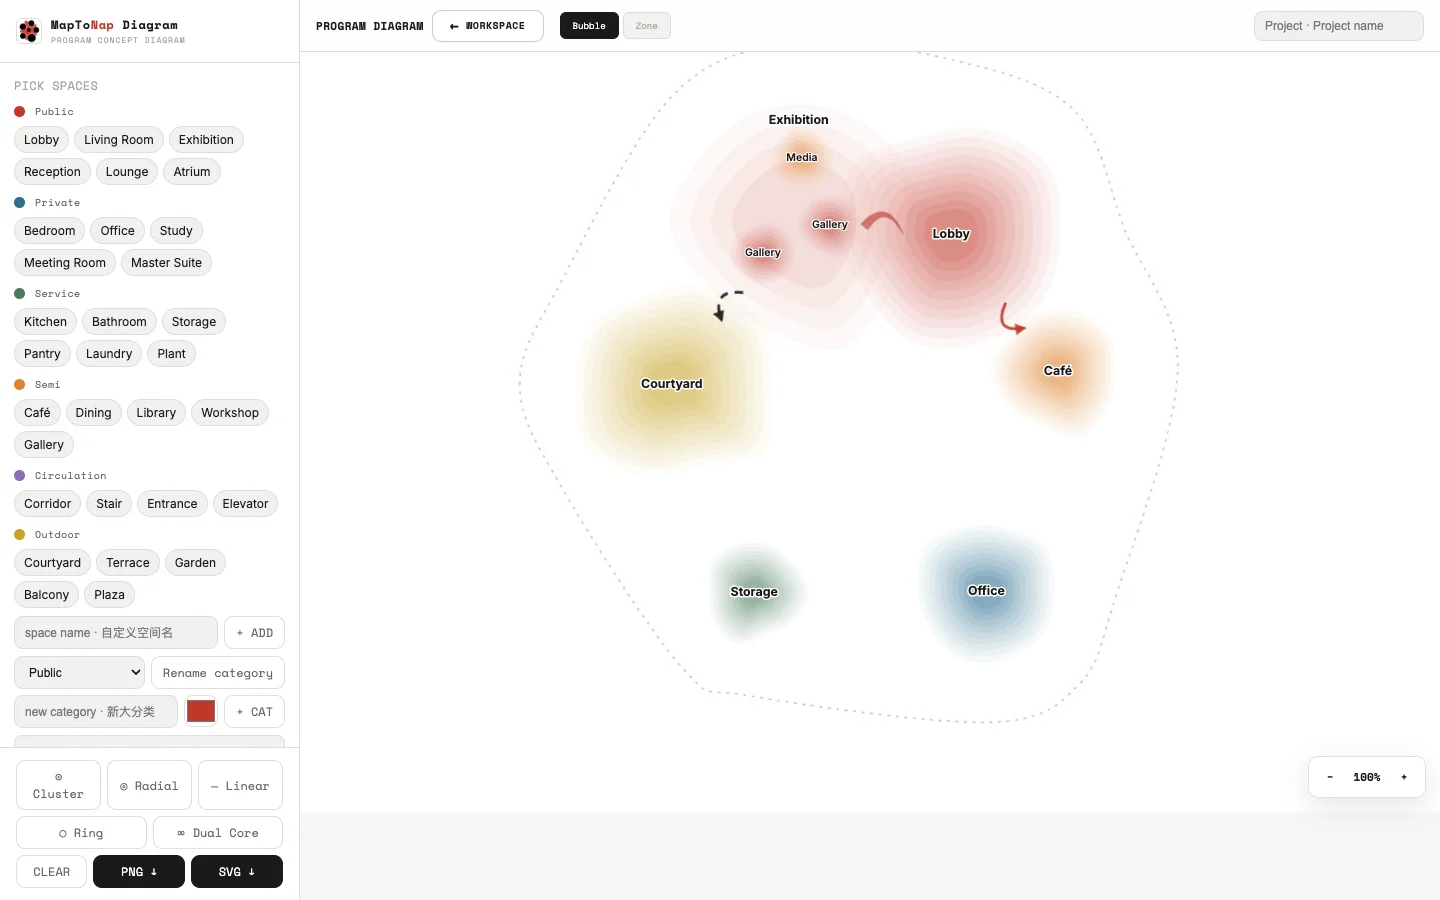
Represent rooms, functions or landscape programs as bubbles before drawing exact plans.
Create a fast initial layout, then move and resize the bubbles to test alternatives.
Use clean palettes and line systems for concept boards and process diagrams.
Add the program items and their relative importance.
Create an initial cluster from the program and adjacency logic.
Move, resize, recolour and refine the diagram for the design story you want to tell.
Draw a loop to add a space, a line between two bubbles to link them, a scribble to delete. Or use the move, link and auto-arrange tools.
Each link says what the spaces need: next to each other, a short walk away, line of sight only, or keep these apart. Linked spaces push and pull each other as you drag.
A score shows which relationships the layout meets and which it does not, so you can see the gaps in the arrangement.
Net area, circulation and walls, and gross area, with a matrix view of every relationship and zones for public, private, quiet or service groups.
Start from a template such as a family house, a courtyard house, a community library or an art gallery, from a blank project, or from the programme sized to your plot in the site analysis.
PNG at the width you choose, on paper, white or transparent, with title, legend and area schedule. Several colour themes and drawing styles.
Bubble Diagram is part of Max. The parametric bubble diagram, with exposed arrangement, spacing and hierarchy parameters, is in the Parametric Lab.
A bubble diagram is an early design tool that represents spaces as abstract shapes to study adjacency, hierarchy and circulation before exact planning.
Yes. The result is editable and can be reorganised after generation.
Yes. Different sizes can be used to communicate program importance or approximate area.
No. The workflow is based on explicit program and graphic rules.